

Node.js의 v8-inpector 디버깅
Node.js를 디버깅하는 방법에 대해서 몇 번 글을 썼다.
Node.js도 계속 발전하면서 디버깅도 점점 좋아지고 있다. 나는 console.log로 로그를 남기면서 디버깅하는 걸 훨씬 좋아하는 편이지만 때로는 디버거를 통해서 문제를 찾아야 하는 경우도 있다. 위에서 쓴 대로 Node.js v6부터 V8의 네이티브 인스펙터가 들어오기 시작했고 이제 이 방식이 표준으로 자리 잡아서 다른 도구들도 대체되거나 인스펙터 방식으로 통일되었다.
Node.js 8.0.0부터는 v8-inspector를 완전히 지원하기 시작해서 기존에 사용하던 --debug가 폐기되고 --inspect로 통일되었고 node-inspect가 Node.js에 통합되었다. 이 글은 예제는 Node.js 8.0.0 이상에서 동작하고 지금은 8.3.0을 사용하고 있다. 자세한 내용은 Debugging Node.js Apps에 잘 나와 있다.
--inspect와 --inspect-brk
bin/www가 구동 파일인 간단한 Express 웹 애플리케이션이 있다고 하면 이를 시작할 때 --inspect 옵션을 주면 된다. --inspect-brk를 사용하면 코드 첫 줄에서 멈추므로 처음부터 디버깅해야 할 때 유용하다.
1$ node --inspect bin/www
2Debugger listening on ws://127.0.0.1:9229/8e704347-66ea-428a-9502-4d23ba374f9f
3For help see https://nodejs.org/en/docs/inspector
위 메시지를 보면 디버거가 열려있는 것을 볼 수 있다. 이는 V8의 인터페이스이므로 이를 지원하는 다른 도구는 어떤 것이라도 사용할 수 있지만 여기서는 크롬 개발자도구를 사용해 보자.
크롬 브라우저에서 chrome://inspect/에 접속하면 Remote Target에서 방금 실행한 Express 애플리케이션을 볼 수 있다.
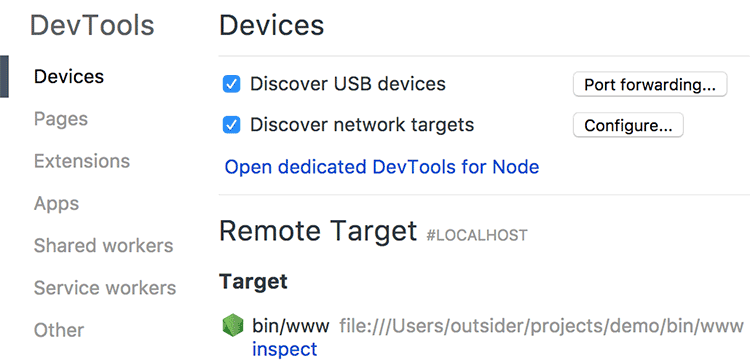
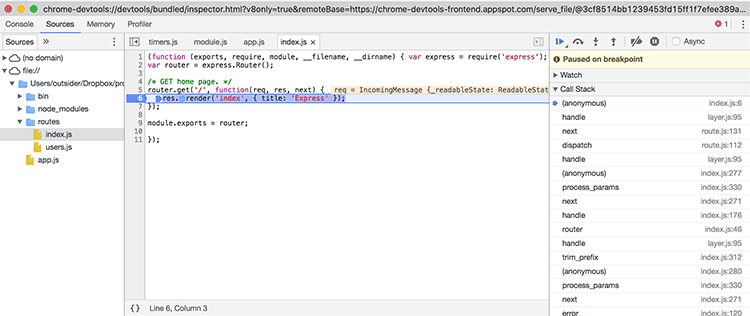
디버깅할 타겟의 "inspect" 버튼을 클릭하면 크롬 개발자도구가 열리고 웹페이지에서 JavaScript를 디버깅하듯이 개발자 도구로 디버깅을 할 수 있다.
1$ node --inspect bin/www
2Debugger listening on ws://127.0.0.1:9229/8e704347-66ea-428a-9502-4d23ba374f9f
3For help see https://nodejs.org/en/docs/inspector
4Debugger attached.
개발자 도구를 연결하면 터미널에서 Debugger attached.라고 나온 것을 볼 수 있다.
기본 포트는 9229인데 다른 포트를 사용하고 싶다면 --inspect=port나 --inspect-brk=port를 사용하면 된다.
node-inspect
node-inspect는 Node.js에 내장된 디버거로 --inpect로 연 디버깅 포트에 접속해서 디버깅할 수 있는 디버거이다. 디버거는 node inspect [js 파일]로 시작한다.(--inpect 대신 inspect이다.)
1$ node inspect bin/www
2< Debugger listening on ws://127.0.0.1:9229/a95f8658-9536-40ee-8a09-57c9313f4947
3< For help see https://nodejs.org/en/docs/inspector
4< Debugger attached.
5Break on start in bin/www:1
6> 1 (function (exports, require, module, __filename, __dirname) {
7  2
8  3 /**
9debug>
커맨드 라인에서 디버깅을 할 수 있는데 다음과 같은 명령어를 사용할 수 있다.
cont,c- 계속 실행한다.next,n- 다음 단계로 이동step,s- 단계 안으로 이동out,o- 단계 밖으로 이동
 1Break on start in bin/www:1
 2> 1 (function (exports, require, module, __filename, __dirname) {
 3  2
 4  3 /**
 5debug> next
 6break in bin/www:7
 7  5  */
 8  6
 9> 7 var app = require('../app');
10  8 var debug = require('debug')('express-test:server');
11  9 var http = require('http');
12debug> step
13break in internal/module.js:10
14  8   function require(path) {
15  9     try {
16>10       exports.requireDepth += 1;
17 11       return mod.require(path);
18 12     } finally {
19debug> out
20break in app.js:28
21 26 app.use('/users', users);
22 27
23>28 debugger;
24 29
25 30 // catch 404 and forward to error handler
26debug>
위처럼 next를 입력하면 다음 단계로 넘어가고 step, out으로 함수 안에 들어가거나 나올 수 있다. debugger;를 코드에 넣어두면 브레이크 포인트로 쓸 수 있으므로 cont를 입력하면 debugger;를 만날 때까지 실행하고 멈춘다.
run이나 restart를 입력하면 처음부터 다시 실행할 수 있고 repl을 입력하면 현 위치에서 코드를 실행해 보거나 원하는 변수를 출력해 볼 수 있다.
 1debug> cont
 2break in app.js:28
 3 26 app.use('/users', users);
 4 27
 5>28 debugger;
 6 29
 7 30 // catch 404 and forward to error handler
 8debug> repl
 9Press Ctrl + C to leave debug repl
10> console.log(app.settings)
11< { 'x-powered-by': true,
12<   etag: 'weak',
13<   'etag fn': [Function: wetag],
14<   env: 'development',
15<   'query parser': 'extended',
16<   'query parser fn': [Function: parseExtendedQueryString],
17<   'subdomain offset': 2,
18<   'trust proxy': false,
19<   'trust proxy fn': [Function: trustNone],
20<   view: [Function: View],
21<   views: '/Users/outsider/Dropbox/projects/temp/express-test/views',
22<   'jsonp callback name': 'callback',
23<   'view engine': 'jade' }
24> undefined
25>
좀 더 자세한 내용은 Debugger 문서를 참고하면 된다.
Comments